Finwaver.com
Your school or business runs better on finwaver.com. Sign up for free one (1) week try.
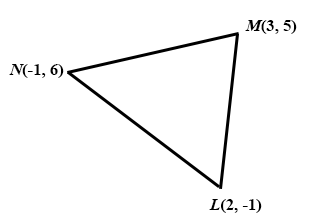
L(2, -1), M(3, 5), N(-1, 6) are the coordinates of the vertices of triangle LMN.
Find, correct to one decimal place, the perimeter of the triangle.
The graph of the relation y = x2 + ax + b, where a and b are constants, cuts the x axis at 3 and the y axis at 6.
(i)
Find the values of a and b.
(ii)
Use the values of a and b to solve x2 + ax + b = 0.
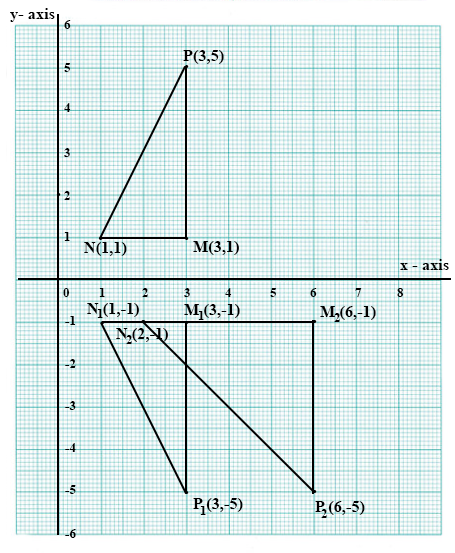
(a)
Using a scale of 2 cm to 1 unit on both axes, draw on a graph sheet two perpendicular axes ox and oy for 0 ≤ x ≤ 8 and -6 ≤ y ≤ 6.
(i)
Plot the points M(3,1), N(1,1) and P(3,5). Join the points to get △MNP.
(ii)
Draw image triangle M1N1P1 which is the reflection of △MNP in the x - axis where M → M1, N → N1 and P → P1. Indicate clearly the coordinates of M1, N1 and P1.
(iii)
Draw the image triangle M2N2P2 which is the image of △MNP under the mapping → , where M → M2, N → N2 and P → P2. Indicate clearly the coordinates of M2, N2 and P2.
(b)
Find the equation of the line joining the points M and M2.
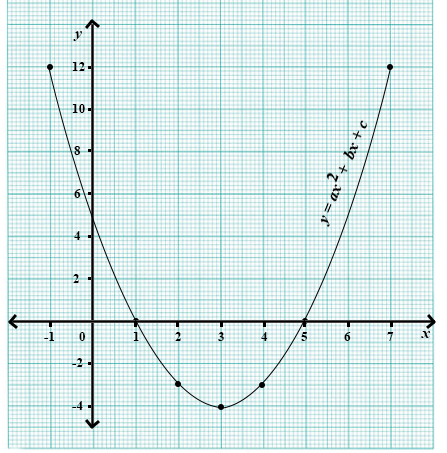
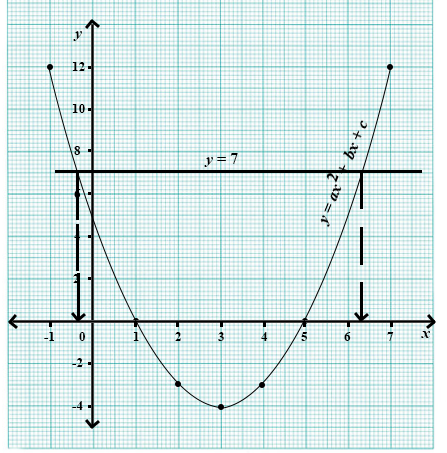
The graph shows the relation of the form y = ax2 + bx + c, where a, b and c are constants.
(a)
State the scale used for each axes.
(b)
Find the values of a, b and c.
(c)
Find the values of x when y = 7.
(d)
Write the coordinates of the minimum point.
(e)
State the range of values of x for which y < 0.
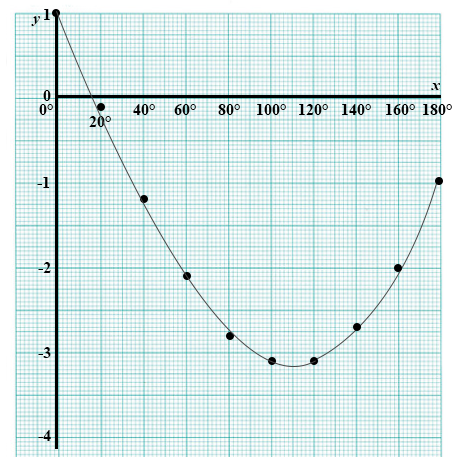
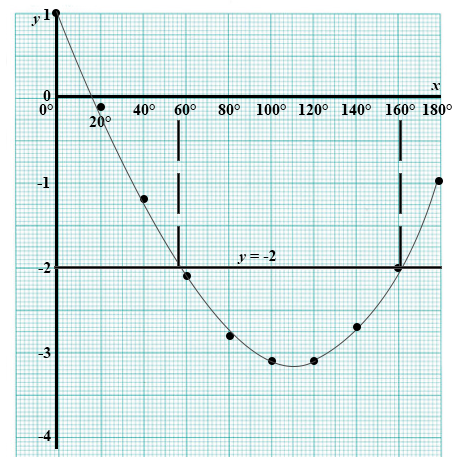
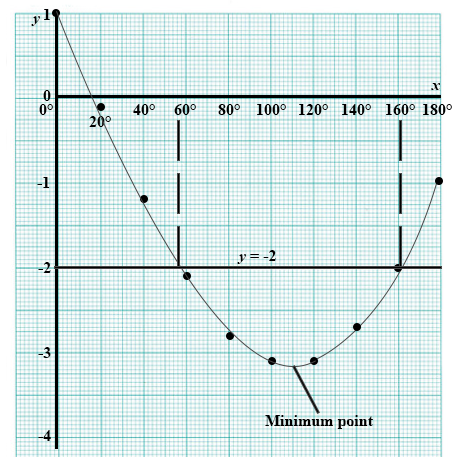
(a)
Copy and complete the table of values for y = cos x - 3 sin x, 0° ≤ x ≤ 180°.
| x | 0° | 20° | 40° | 60° | 80° | 100° | 120° | 140° | 160° | 180° |
| y | 1.0 | -2.1 | -2.0 |
(b)
Using a scale of 2 cm to 20° on the x axis and 4 cm to 1 unit on the y axis, draw the graph of y = cos x - 3 sin x, 0° ≤ x ≤ 180°.
(c)
Using the graph, find the:
(i)
truth set of 2 + cos x = 3 sin x;
(ii)
range of values of x for which y increases as x increases;
(iii)
minimum point of the curve.
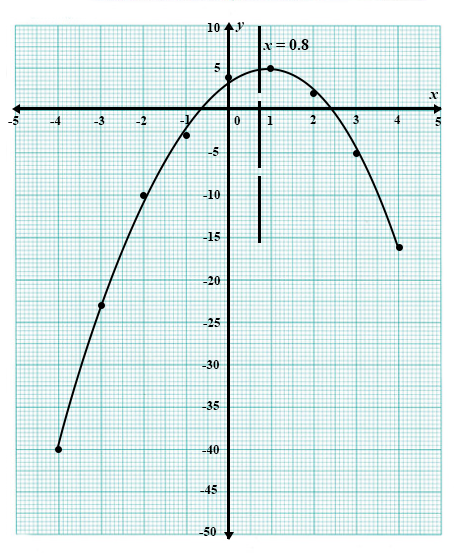
(a)
Copy and complete the table of values for the relation y = 4 + 3x - 2x2, for -4 ≤ x ≤ 4.
| x | -4 | -3 | -2 | -1 | 0 | 1 | 2 | 3 | 4 |
| y | -10 | 4 | 2 |
(b)
Using a scale of 2 cm to 1 unit on the x – axis and 2 cm to 5 units on the y – axis, draw the graph for the relation y = 4 + 3x - 2x2, for -4 ≤ x ≤ 4.
(c)
Using the graph, find the:
(i)
equation of line of symmetry of the curve;
(ii)
maximum point of the curve;
(iii)
values of x for which y decreases as x increases.
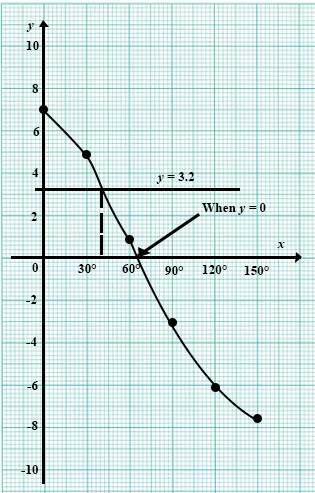
(a)
Copy and complete the table of values for the relation y = 7cos x - 3sin x.
| x | 0° | 30° | 60° | 90° | 120° | 150° |
| y | 7.0 | -3.0 |
(b)
Using a scale of 2 cm to 30° on the x-axis and a scale of 2 cm to 2 units on the y-axis, draw the graph of y = 7cos x - 3sin x for 0° ≤ x ≤ 150°.
(c)
Use the graph to solve the equations:
(i)
7cos x = 3sin x;
(ii)
7cos x = 3.2 + 3sin x.
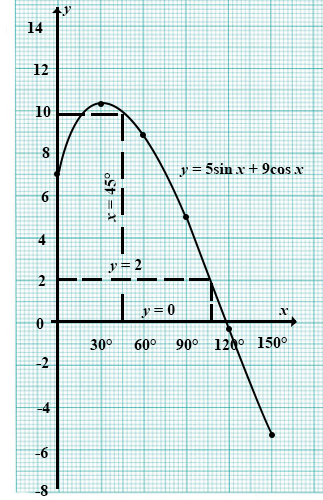
(a)
Copy and complete the table of values for y = 5sin x + 9cos x for 0° ≤ x ≤ 150°.
| x | 0° | 30° | 60° | 90° | 120° | 150° |
| y | 10.3 | -0.2 |
(b)
Using a scale of 2 cm to 30° on the x-axis and 2 cm to 2 units on the y-axis, draw the graph of y = 5sin x + 9cos x for 0° ≤ x ≤ 150°.
(c)
Use the graph to solve the equations:
(i)
5sin x + 9cos x = 0;
(ii)
5sin x + 9cos x = 2.
(d)
Using the graph, find, the value of y when x = 45°.
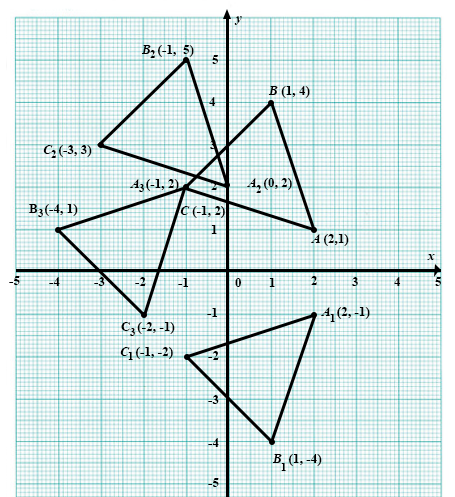
(a)
Using a scale of 2 cm to 1 unit on both axes, draw on a sheet of graph paper, two perpendicular axes 0x and 0y for – 5 ≤ x ≤ 5 and – 5 ≤ y ≤ 5.
(b)
Draw on the same graph sheet, indicating clearly all vertices and their coordinates:
(i)
∆ ABC with vertices A(2, 1), B(1, 4) and C(–1, 2);
(ii)
the image ∆ A1B1C1 of ∆ ABC under a reflection in the line y = 0, where A→A1, B→B1 and C→C1;
(iii)
the image ∆ A2B2C2 of ∆ ABC under a translation by the vector , where A→A2,B→B2 and C→C2;
(iv)
the image ∆ A3B3C3 of ∆ ABC under an anticlockwise rotation of 90° about the origin, where A→A3, B→B3 and C→C3.
(c)
What single transformation maps ∆ A1B1C1 onto ∆ A3B3C3, where A1→A3, B1→B3 and C1→C3?
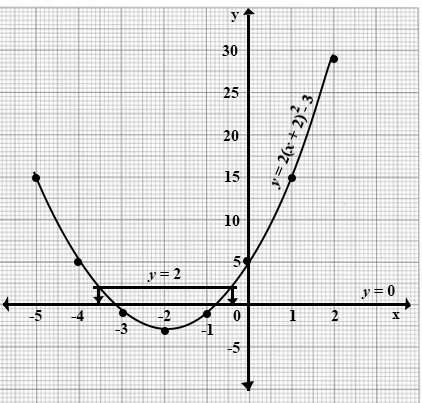
(a)
Copy and complete the following table for the relation: y = 2(x + 2)2 - 3 for -5 ≤ x ≤ 2.
| x | -5 | -4 | -3 | -2 | -1 | 0 | 1 | 2 |
| y | -1 | -3 | 5 |
(b)
Using scales of 2 cm to 1 unit on the x-axis and 2 cm to 5 units on the y-axis, draw the graph of the relation y = 2(x + 2)2 - 3 for -5 ≤ x ≤ 2.
(c)
Use the graph to find the solution of:
(i)
2(x + 2)2 = 3;
(ii)
2(x + 2)2 = 5.
(d)
For what values of x, from the graph is y increasing in the interval?
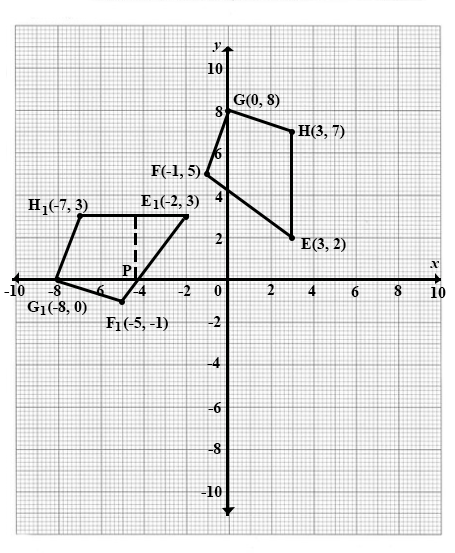
(a)
Using scales of 2 cm to 2 units on both axes, draw on a sheet of graph paper two perpendicular axes 0x and 0y for -10 ≤ x ≤ 10 and -10 ≤ y ≤ 10.
(b)
Given point E(3, 2), F(-1, 5) and the vectors FG→ = and GH→ = , find the coordinates of the points G and H.
(c)
Draw, on the same graph, indicating clearly the vertices and their coordinates, the
(i)
quadrilateral EFGH;
(ii)
image E1F1G1H1 of the quadrilateral EFGH under an anticlockwise rotation of 90° about the origin where E → E1, F → F1, G → G1 and H → H1.
(d)
The side E1F1 of the quadrilateral E1F1G1H1 cuts the x-axis at the point P.
Calculate, correct to one decimal place, the area of E1H1G1P1.
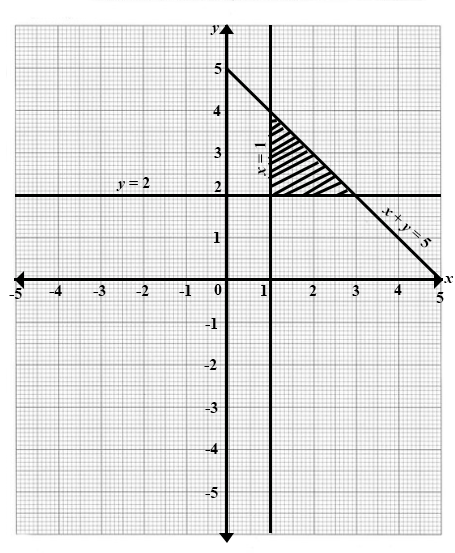
(i)
Draw on a graph paper, using a scale of 2 cm to 1 unit on both axes, the lines x = 1; y = 2; and x + y = 5.
(ii)
Shade the region which satisfies simultaneously the inequalities x + y ≤ 5; y ≥ 2 and x ≥ 1
The midpoint of the line joining Y(2a, 3) and Z(-4, b) is M(1, 2a - 1). Find:
(a)
the values of a and b;
(b)
|YZ|.


Digital Address: GZ-033-0057
King Kotey Road
Teshie - Accra
Ghana
+233 54 753 9118
info@kuulchat.com
![]()
© Copyright 2015 - 2026
All Rights Reserved