Finwaver.com
Your school or business runs better on finwaver.com. Sign up for free one (1) week try.
The mean age, in years, of t girls in a class was 17.6. At the end of the academic year, 4 girls aged 16, 19, 20 and 17 were dismissed. The new mean age of girls in the class became 0.2 less than the original mean.
Find the value of t.
| Height (m) | 9 | 10 | 11 | 12 | 13 | 14 |
| Number of buildings | 5 | 4 | 6 | 5 | 6 | 4 |
The table shows the height (m) of 30 selected buildings in a town.
(a)
Find the mean height of the buildings.
(b)
Calculate, correct to one decimal place, the:
(i)
median;
(ii)
mean deviation.
The mean age of a second year class of a school is 18. At the end of the promotion examination, 3 students aged 20, 19 and 19 years were repeated. The new mean age of the class became 18.
Calculate the number of students who were in the class before the promotion examination.
| Heights(cm) | 60 - 64 | 65 - 69 | 70 - 74 | 75 - 79 | 80 - 84 |
| Frequency | 7 | 6 | 5 | 8 | 4 |
The table shows the distribution of height of seedlings in a nursery. Calculate, correct to one decimal place, the:
(i)
mean;
(ii)
variance of the distribution.
| Age (years) | 7 | 8 | 9 | 10 | 11 | 12 |
| Number of children | 2x | 3x | 4x - 1 | x | x - 2 | x - 3 |
The table shows the ages in years of 42 children at a birthday party.
(a)
Find the value of x
(b)
Calculate, correct to the nearest whole number, the mean age.
(c)
Find the probability of selecting at random a child whose age is not less than 9 years.
The following are arranged in order of size: (x – 2), 4, (x + 2), (2x + 1) and 9.
If the median is equal to the mean, find the value of x
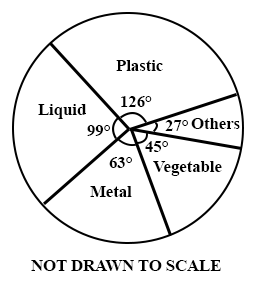
The average mass of refuse generated in a community in a week contains 35% plastic, 27.5% liquid, 17.5% metal, 12.5% vegetable matter and others 7.5%. Draw a pie chart to illustrate the information.
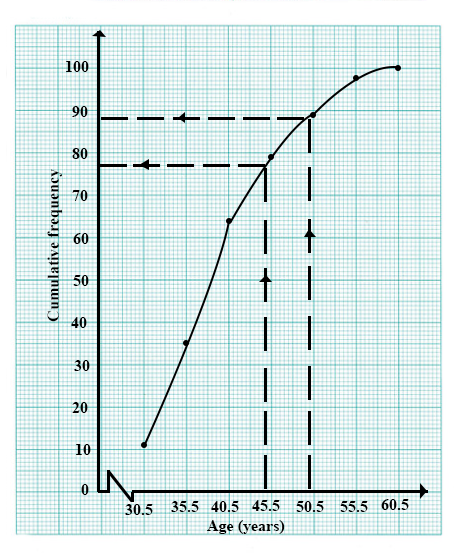
The table shows the age distribution of workers in a company.
| Age (years) | 26 - 30 | 31 - 35 | 36 - 40 | 41 - 45 | 46 - 50 | 51 - 55 | 56 - 60 |
| Number of workers | 11 | 24 | 29 | 15 | 10 | 9 | 2 |
(a)
Construct a cumulative frequency table and use it to draw a cumulative frequency curve.
(b)
Use the curve to estimate the:
(i)
probability of selecting a worker whose age is not more than 45 years;
(ii)
number of workers who will retire if the retiring age is 50 years and above.
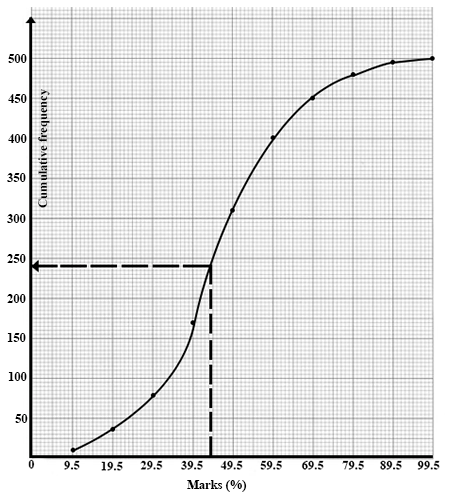
The table shows the distribution of marks scored by 500 candidates in an examination.
| Marks | 0 - 9 | 10 - 19 | 20 - 29 | 30 - 39 | 40 - 49 | 50 - 59 | 60 - 69 | 70 - 79 | 80 - 89 | 90 - 99 |
| Frequency | 10 | 28 | 40 | 92 | y + 60 | 90 | 50 | 30 | 15 | 5 |
(a)
Find the value of y.
(b)
Construct a cumulative frequency table and use it to draw a cumulative frequency curve.
(c)
Use the curve to estimate the probability of selecting a candidate who scored not more than 45%.


Digital Address: GZ-033-0057
King Kotey Road
Teshie - Accra
Ghana
+233 54 753 9118
info@kuulchat.com
![]()
© Copyright 2015 - 2026
All Rights Reserved